

Progress Overview
The Progress tab is where you see your GLP-1 journey visualized. Charts, trends, and insights help you understand how your body is responding to treatment.
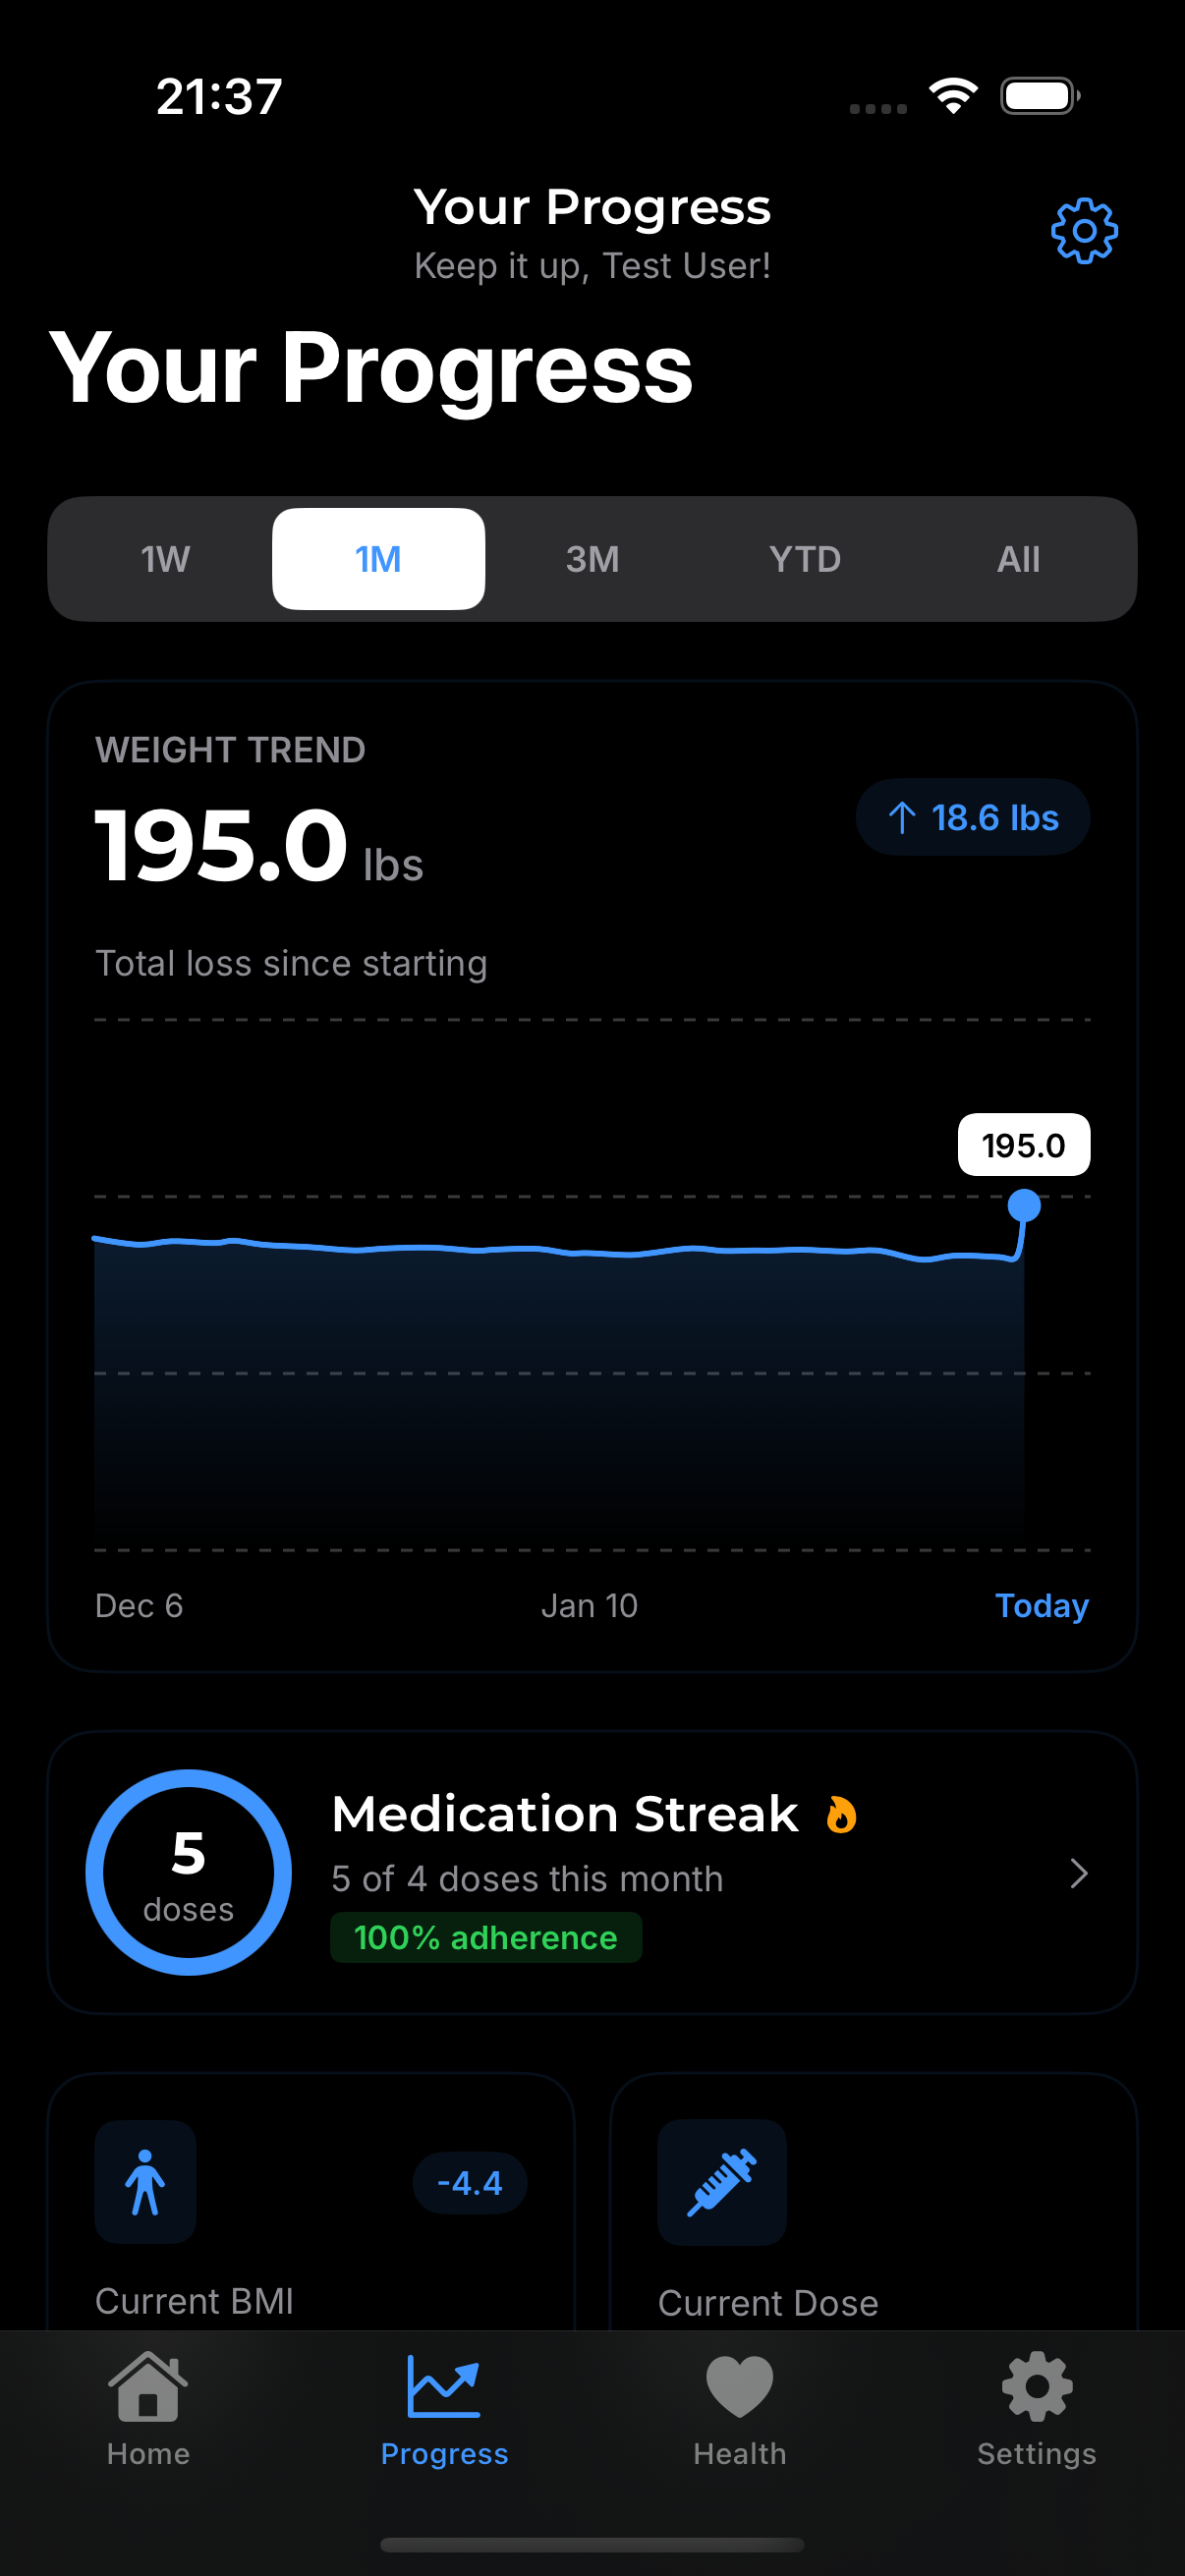
What You'll Find
Weight Progress
Your weight journey at a glance:
- Line chart showing weight over time
- Trend line smoothing out daily fluctuations
- Starting point and current weight
- Goal line (if you've set a weight goal)
Dose History
Visual timeline of your injections:
- All logged doses plotted over time
- Protocol changes marked when you switched doses
- Streaks showing consistency
Health Metrics
Other tracked data visualized:
- Water intake daily and weekly patterns
- Symptom frequency and severity trends
- Check-in history over time
Using the Progress Tab
Selecting Time Ranges
At the top of Progress, choose your view:
- 1 Week - Recent activity
- 1 Month - Short-term trends
- 3 Months - Medium-term progress
- 6 Months - Longer patterns
- All Time - Your complete journey
Switching Metrics
Tap different sections to view:
- Weight chart
- Dose timeline
- Water intake
- Symptoms
- Injection sites
Zooming and Panning
On charts:
- Pinch to zoom in on specific periods
- Swipe to pan across time
- Tap a point to see exact values
Key Insights
Weight Loss Rate
GLPea calculates your average weekly weight change:
- Shown as pounds or kg per week
- Helps set realistic expectations
- Useful for discussing progress with your doctor
Consistency Score
Based on your logging habits:
- Did you log doses on schedule?
- How many weeks in a row?
- Are you tracking metrics regularly?
Symptom Trends
See if side effects are:
- Improving over time (common as body adjusts)
- Stable at current levels
- Worsening (may need discussion with provider)
Sharing Your Progress
Screenshots
Take a screenshot of any chart to share or save. The chart captures beautifully for messaging or social media.
Export Reports
For a formal summary:
- Settings → Provider Report or Export Health Data
- Select what to include
- Export as PDF
Progress Tips
Focus on Trends
Individual data points matter less than the overall direction. Don't get discouraged by a single "bad" weigh-in—look at the bigger picture.
Regular Logging
The more data you log, the more useful your progress charts become. Consistent tracking = better insights.
Celebrate Milestones
Notice when you hit goals or achieve streaks. GLPea helps you see your wins, not just the work ahead.
Common Questions
Why doesn't my chart show anything? You need at least 2-3 data points for charts to display. Keep logging!
Can I compare different time periods? Currently, you can switch between time ranges. Direct comparison features may come in future updates.
My progress seems slow—is that normal? GLP-1 weight loss varies greatly by person. Average is 5-15% of body weight over time. Slow and steady is healthy.